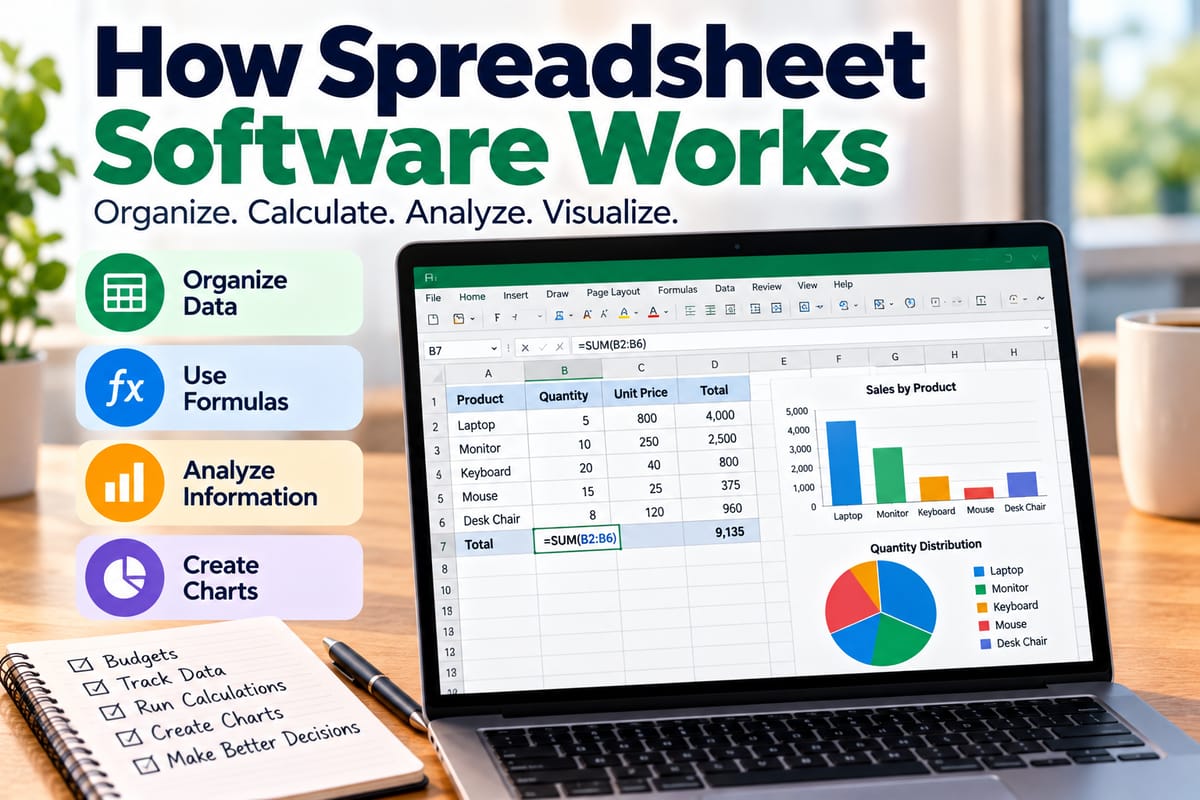
How Spreadsheet Software Works
Spreadsheet software is one of the most widely used types of computer software for organizing, calculating, analyzing and presenting information.
From household budgets and school assignments to business forecasts and financial models, spreadsheets allow users to arrange information into rows and columns and then perform calculations or analyze relationships between data.
Modern spreadsheet applications have evolved considerably beyond simple digital tables. They can contain formulas, charts, pivot tables, automation tools, collaboration features, data-import capabilities and sophisticated functions for analyzing large datasets.
Understanding how spreadsheet software works helps explain why these applications remain useful across so many different industries and everyday tasks.
What Is Spreadsheet Software?
Spreadsheet software is an application designed to organize data in a grid made up of rows and columns.
The intersection of a row and a column creates a cell. Each cell can contain information such as:
- Text
- Numbers
- Dates
- Formulas
- Functions
- References to other cells
Users can combine individual cells into tables, calculations, reports, models and dashboards.
Popular spreadsheet applications include Microsoft Excel, Google Sheets, Apple Numbers and various specialized spreadsheet tools.
Although their interfaces differ, most spreadsheet applications are built around similar concepts: cells, formulas, functions, worksheets and workbooks.
How a Spreadsheet Is Structured
A spreadsheet typically consists of several layers.
Workbook
A workbook is the overall spreadsheet file or document.
A workbook can contain one or many worksheets.
Worksheet
A worksheet is an individual spreadsheet page containing a grid of cells.
A workbook might contain separate worksheets for:
- Sales
- Expenses
- Inventory
- Employees
- Budgets
- Forecasts
Rows
Rows run horizontally across the worksheet and are generally identified by numbers.
For example:
- Row 1
- Row 2
- Row 3
Columns
Columns run vertically and are generally identified by letters.
For example:
- Column A
- Column B
- Column C
Cells
A cell is identified by its column and row.
For example, B4 refers to the cell in column B and row 4.
This cell-address system allows formulas to reference specific pieces of information.
How Data Is Stored in Cells
Each cell can contain different types of information.
For example:
| Product | Quantity | Price |
|---|---|---|
| Laptop | 5 | 800 |
| Monitor | 10 | 250 |
| Keyboard | 20 | 40 |
The spreadsheet stores each value in its own cell.
The word "Laptop" is stored separately from the number 5 and the price 800.
This structure allows the spreadsheet to perform calculations using the underlying values.
For example, if quantity is stored in cell B2 and price is stored in C2, a formula in another cell could multiply those values to calculate the total.
How Spreadsheet Formulas Work
Formulas are one of the most important features of spreadsheet software.
A formula tells the spreadsheet to perform a calculation.
For example:
=B2*C2
This formula multiplies the value in B2 by the value in C2.
If B2 contains 5 and C2 contains 800, the result would be 4,000.
The important part is that the formula refers to the cells rather than permanently storing the answer.
If the value in B2 changes from 5 to 6, the spreadsheet can recalculate the result automatically.
This makes spreadsheets particularly useful for models where information changes regularly.
How Spreadsheet Functions Work
Spreadsheet software also provides built-in functions that perform common calculations.
Examples include:
SUMAVERAGECOUNTMINMAXIFROUNDXLOOKUPVLOOKUP
For example:
=SUM(B2:B10)
can calculate the total of the values in cells B2 through B10.
Functions save users from having to write complicated formulas repeatedly.
Cell References
Cell references allow formulas to use information stored elsewhere in a worksheet.
A formula might reference:
=A1+B1
This tells the spreadsheet to add the values in A1 and B1.
References can also cover ranges of cells.
For example:
=SUM(A1:A20)
uses all the values from A1 through A20.
This system allows a spreadsheet to connect many calculations together.
Relative and Absolute References
Spreadsheet software can treat cell references differently when formulas are copied.
A relative reference changes when a formula is moved or copied.
For example:
=A2*B2
copied down one row might become:
=A3*B3
An absolute reference is designed to remain fixed.
For example:
=$B$1
continues referring to B1 even when the formula is copied elsewhere.
Mixed references can also lock either the row or the column.
These reference systems make it possible to build formulas that can be reused across large tables.
How Automatic Recalculation Works
One of the defining features of spreadsheet software is automatic recalculation.
Suppose a worksheet contains:
Revenue – Expenses = Profit
If the revenue figure changes, the spreadsheet can recalculate the profit automatically.
Behind the scenes, the application maintains relationships between formulas and the cells they depend on.
When an input changes, the software can determine which calculations need to be updated.
This makes spreadsheets useful for budgets, forecasts, financial models and other systems where inputs change frequently.
Formatting Data
Spreadsheet software separates the underlying data from much of its visual formatting.
Users can change:
- Font
- Font size
- Number format
- Borders
- Alignment
- Background appearance
- Decimal places
- Currency display
- Date display
For example, the underlying value might be 0.25 while the cell is formatted as 25%.
Similarly, a number can be displayed as a currency value without changing the underlying numeric value used in calculations.
This distinction allows spreadsheets to present information clearly while maintaining usable data underneath.
Sorting and Filtering Data
Spreadsheet software can organize datasets by sorting and filtering their contents.
Sorting can arrange information by:
- Alphabetical order
- Numerical value
- Date
- Highest to lowest
- Lowest to highest
Filtering allows users to display only records that meet particular conditions.
For example, a sales spreadsheet could contain thousands of transactions, but a filter could display only sales from one region or one month.
These tools make spreadsheets useful for exploring structured datasets.
Tables in Spreadsheet Software
Many modern spreadsheet applications allow users to convert ranges of information into structured tables.
Tables can provide features such as:
- Automatic formatting
- Filter controls
- Structured references
- Automatic expansion
- Sorting
- Consistent formulas
Tables can make large datasets easier to manage because the application recognizes the information as a structured collection rather than simply a group of unrelated cells.
How Charts Work
Spreadsheets can transform numerical data into visual charts.
Common chart types include:
- Bar charts
- Column charts
- Line charts
- Pie charts
- Area charts
- Scatter plots
For example, monthly sales data can be represented as a line chart showing how sales changed over time.
Charts can make patterns easier to identify than a table containing hundreds of individual numbers.
However, choosing an appropriate chart type matters. A chart should make the underlying information easier to understand rather than simply adding decoration.
Pivot Tables and Data Summaries
Pivot tables are powerful tools for summarizing large datasets.
Imagine a sales spreadsheet containing thousands of transactions. Each row could include:
- Date
- Customer
- Product
- Region
- Salesperson
- Revenue
A pivot table can summarize that information by region, product or month without requiring the user to manually reorganize the original dataset.
For example, a pivot table might show total sales by region:
| Region | Total Sales |
|---|---|
| North | $125,000 |
| South | $98,000 |
| East | $143,000 |
| West | $117,000 |
Pivot tables are particularly useful for reporting and exploratory analysis.
Spreadsheet Software and Data Analytics
Spreadsheets are often used as an entry point into data analysis.
Users can clean datasets, calculate statistics, identify trends and create visualizations without necessarily needing specialized analytics software.
For organizations that rely heavily on data, spreadsheets can complement more advanced analytics systems.
The broader role of analytics in organizations is covered in The Complete Guide to Data Analytics for Business.
Spreadsheets are particularly useful for smaller datasets, quick analysis, ad hoc calculations and situations where users need direct control over the data.
Spreadsheet Software and Business Intelligence
Business intelligence systems generally provide more structured approaches to collecting, analyzing and presenting organizational data.
However, spreadsheets can still play a role in business intelligence workflows.
For example, users may export data from a business system, analyze it in a spreadsheet and create a quick report before information is incorporated into a larger reporting environment.
Business intelligence platforms can provide more centralized dashboards, automated reporting and data integration. The broader subject is explored in How Business Intelligence Helps Businesses Make Better Data-Driven Decisions.
Data Validation
Data validation helps control what users can enter into particular cells.
For example, a spreadsheet might require users to select a department from a predefined list rather than typing the department manually.
Validation can help reduce errors caused by inconsistent data entry.
Possible validation rules can include:
- Dropdown lists
- Number ranges
- Date ranges
- Text-length limits
- Required formats
This is particularly useful when several people enter information into the same spreadsheet.
Conditional Formatting
Conditional formatting changes the appearance of cells when particular conditions are met.
For example, a financial spreadsheet could highlight:
- Expenses above a certain amount
- Overdue dates
- Low inventory
- Negative results
- High-performing sales figures
Conditional formatting makes important patterns more visible without requiring users to examine every cell manually.
How Spreadsheet Software Handles Errors
Formulas can produce errors when they contain invalid references, incorrect data or incompatible operations.
Spreadsheet applications typically display error indicators such as:
#DIV/0!#VALUE!#REF!#NAME?#N/A
These messages provide clues about what went wrong.
For example, dividing a number by zero can generate a division-by-zero error.
Users can also use error-handling functions to manage certain situations more gracefully.
Linking Worksheets
A workbook can contain multiple worksheets that reference one another.
For example:
Sales worksheet → Revenue summary → Management dashboard
A summary sheet could use formulas that pull information from a detailed sales worksheet.
This allows users to separate raw data from calculations and presentation.
A well-structured workbook might therefore contain:
- Raw data
- Calculations
- Analysis
- Reports
- Charts
Separating these layers can make complex spreadsheets easier to maintain.
Linking Multiple Workbooks
Some spreadsheet applications allow formulas or data connections between separate spreadsheet files.
This can be useful when different departments maintain separate datasets.
However, external links can also create maintenance challenges.
If a referenced file is moved, renamed or deleted, formulas may stop working correctly.
For this reason, organizations should carefully manage dependencies between spreadsheet files.
Importing Data
Modern spreadsheet software can import data from many sources.
Depending on the application, users may be able to import:
- CSV files
- Text files
- Databases
- Web data
- Other spreadsheets
- Cloud services
- Business systems
Import tools can save time when working with information generated outside the spreadsheet itself.
Cleaning Data in Spreadsheets
Data imported into a spreadsheet may contain inconsistencies.
For example:
Nairobi
nairobi
NAIROBI
Nairobi
Although these entries may represent the same location, a computer can treat them as different text values.
Spreadsheet tools can help users clean data by:
- Removing unnecessary spaces
- Standardizing capitalization
- Removing duplicates
- Splitting text into columns
- Combining fields
- Converting formats
- Identifying missing values
Good data preparation is important because inaccurate or inconsistent information can produce misleading results.
Collaboration Features
Traditional spreadsheet files were often designed primarily for one person to edit at a time.
Modern cloud-based spreadsheet applications can support multiple users working on the same document.
Collaboration features can include:
- Simultaneous editing
- Comments
- Version history
- Sharing permissions
- Activity tracking
- Automatic saving
These features allow teams to work together without repeatedly emailing different versions of the same file.
Spreadsheet Permissions
Collaboration also creates a need for access controls.
Users may be able to assign different levels of access, such as:
- View only
- Comment
- Edit
- Full administrative control
Permissions can help prevent unauthorized changes to important information.
For sensitive business spreadsheets, access management becomes particularly important.
Automation in Spreadsheet Software
Modern spreadsheet applications can automate repetitive tasks.
Automation can involve:
- Macros
- Scripts
- Formulas
- Templates
- Automated imports
- Data refreshes
- Workflow integrations
For example, an automated process might import updated sales data and refresh calculations and charts.
Automation can save time, but it should be designed carefully. A complicated automation system can become difficult to understand or maintain if documentation is poor.
Spreadsheets in Business
Businesses use spreadsheets for many purposes.
Common applications include:
- Budgeting
- Financial analysis
- Inventory management
- Sales tracking
- Project planning
- Employee records
- Forecasting
- Expense management
- Pricing
- Reporting
Spreadsheets are often particularly useful when users need flexibility.
For a broader look at the software used across organizations, Complete Guide to Business Software provides additional context.
Financial Modeling
Financial models use formulas and assumptions to explore possible outcomes.
A simple business model might include:
Revenue → Costs → Profit
A more sophisticated model might include:
- Revenue growth
- Operating expenses
- Taxes
- Debt
- Interest
- Capital expenditure
- Cash flow
- Multiple scenarios
Changing an assumption can automatically update other parts of the model.
This makes spreadsheets useful for scenario analysis.
What-If Analysis
Spreadsheets can also help users explore hypothetical situations.
For example:
What happens to profit if sales increase by 10%?
Or:
What happens if operating costs increase by 5%?
A model can contain assumptions that users change to observe different outcomes.
This is often called what-if analysis.
It allows decision-makers to explore possibilities without changing the underlying real-world operation.
Spreadsheet Templates
Templates provide pre-built spreadsheet structures for common tasks.
Examples include:
- Personal budgets
- Invoices
- Calendars
- Project trackers
- Expense reports
- Inventory lists
- Financial forecasts
Templates reduce the amount of time required to create a spreadsheet from scratch.
Users can modify the template to fit their particular needs.
Common Spreadsheet Mistakes
Despite their usefulness, spreadsheets can contain errors.
Common problems include:
Incorrect Formulas
A single incorrect reference can affect many calculations.
Manual Data Entry Errors
Typing information manually creates opportunities for mistakes.
Inconsistent Formatting
Numbers, dates and text can be stored in inconsistent formats.
Hidden Rows or Columns
Important information can accidentally be overlooked.
Duplicate Data
Repeated records can distort totals and analysis.
Broken References
Moving or deleting cells can cause formulas to reference the wrong information.
Poor Documentation
A complicated spreadsheet can become difficult to understand when the original creator is unavailable.
Why Spreadsheet Structure Matters
A spreadsheet can become difficult to manage as it grows.
A small personal budget may contain only a few dozen cells. A business workbook can contain thousands or even millions of cells across multiple worksheets and data sources.
Good structure becomes increasingly important as complexity increases.
Useful practices include:
- Clearly naming worksheets
- Separating raw data from calculations
- Using consistent formulas
- Avoiding unnecessary complexity
- Documenting important assumptions
- Using meaningful column headings
- Protecting critical cells
- Keeping backup copies
These practices can reduce errors and make spreadsheets easier for other people to understand.
When Spreadsheets May Not Be Enough
Spreadsheets are powerful, but they are not ideal for every task.
An organization may need specialized software when:
- Thousands of users require access
- Data volumes become extremely large
- Complex security controls are necessary
- Real-time transaction processing is required
- Many systems need to share the same database
- Workflows need centralized management
- Data must be governed across an organization
For example, a business might eventually replace a collection of spreadsheets with a database, enterprise application or specialized business platform.
The decision depends on the organization's requirements.
Spreadsheet Software Compared With Databases
Spreadsheets and databases both store structured information, but they are designed for different types of work.
Spreadsheets are often highly flexible and user-friendly.
Databases are generally designed to manage structured information at larger scales while supporting controlled access, relationships between datasets and multiple users.
A business might use a spreadsheet for quick analysis while storing its core operational data in a database.
These systems can also work together.
Spreadsheet Software Compared With Specialized Applications
A spreadsheet can sometimes perform a task that could also be handled by specialized software.
For example, a small business could track inventory using a spreadsheet.
As inventory operations become more complex, however, dedicated inventory-management software might provide better automation, controls and integration.
The right choice depends on factors such as:
- Number of users
- Data volume
- Complexity
- Security
- Automation
- Integration
- Cost
- Reporting requirements
Understanding the broader categories of applications can help users recognize when a spreadsheet is appropriate and when another type of software may be more suitable. See Different Types of Software Applications and What They Are Used For for additional context.
How Spreadsheet Files Are Saved
Spreadsheet applications can save information in different file formats.
One widely used format is the Excel workbook format, commonly associated with .xlsx files.
Other formats include:
.csv.ods.xls- Application-specific cloud formats
Different formats support different capabilities.
For example, a CSV file primarily stores tabular data and does not preserve all the formatting, formulas and workbook features available in more sophisticated spreadsheet formats.
Choosing an appropriate format therefore depends on how the file will be used.
The Role of Spreadsheets in Everyday Computing
Spreadsheet software remains popular because it combines several capabilities in one environment.
A user can:
- Enter data.
- Organize it into a table.
- Calculate values.
- Apply formulas.
- Filter information.
- Create charts.
- Analyze trends.
- Build reports.
- Share the document.
- Update the information as circumstances change.
This flexibility allows spreadsheets to serve as both simple productivity tools and sophisticated analytical environments.
How Spreadsheet Software Continues to Evolve
Modern spreadsheet applications increasingly incorporate cloud collaboration, automation, artificial intelligence, data connectors and advanced analytics.
This evolution means spreadsheets are becoming more connected to other software systems.
Instead of being isolated files stored on one computer, spreadsheets can now participate in broader workflows involving databases, cloud services, business intelligence platforms and other applications.
At the same time, their fundamental structure remains familiar: users organize information into cells and use formulas and functions to transform that information into useful results.
The Practical Value of Spreadsheet Software
Spreadsheet software works by combining structured data storage with formulas, functions, references, analysis tools and visual presentation.
At the simplest level, it can be a convenient digital table for recording information. At a more advanced level, it can become a flexible environment for financial modeling, business analysis, forecasting, reporting and decision support.
Its greatest strength is flexibility. Users can adapt a spreadsheet to many different problems without necessarily needing specialized programming knowledge.
That flexibility also creates responsibility. As spreadsheets become more complicated, careful structure, data validation, documentation, security and quality control become increasingly important.
When used appropriately, spreadsheet software provides a practical bridge between basic data organization and more advanced analytical and business systems.